Topographic Information from Multiple Beam Interferometry in the Surface Forces Apparatus
Introduction
The Surface Forces Apparatus (SFA) uses Multiple Beam Interferometry (MBI) to measure the geometry and refractive index in the contact area of two crossed cylinders. Therefore, two sheets (2-4µm thick) of mica or other material are cleaved and then prepared by evaporating a thin (~550Å) layer of silver on the outer side. The sheets are then glued on silica disks (silver side down) that are polished with a cylindrical shape. The use of two crossed cylinders assures a well defined geometry for the force measurement.
In traditional experiments, MBI is exclusively used to determine the exact distance between the surfaces inside the contact area. The resolution of MBI in the z-axis is in general better than 1Å, which makes the SFA an ideal instrument for force and distance measurements, down to molecular dimensions. However, there is much more information accessible with MBI.
Traditionally, the surfaces used in the SFA are atomically flat and smoth (e.g. mica). Hence, common mathematical solutions to describe the measured wavelentgh of Fringes of Equal Chromatic Order (FECO) are for a symmetrical system of ideally flat surfaces.
Recently, I have made some measurements with polymer films in the SFA. Since my polymer samples are not atomically smoth and symmetric, it is difficult to understand some 'non-standard' features in the fringes with the conventional FECO equations. This is how I started to think about optics and MBI in more detail...
Reflections on inner boundaries
Due to different refractive indicies inside a three-layer interferometer a normal incident wave experiences additional reflections at the inner boundaries. The reflection coefficient at a boundary from medium 1 to medium 2 is given by the following simple relation:
r12 := µ1-µ2 / (µ1+µ2)
where µ1 and µ2 are the refractive indicies of medium 1 and 2 respectively.
All the possible reflections together give rise to a total of six sets of FECO patterns inside the three layer interferometer.
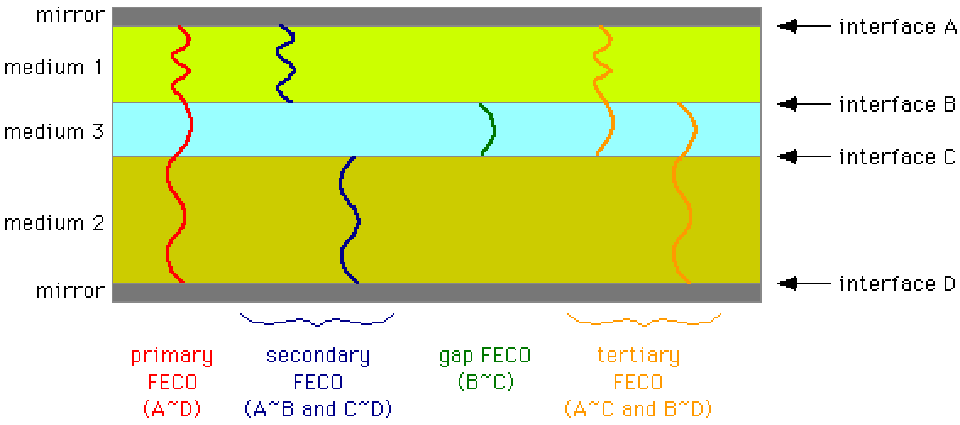
The phenomenon of primary fringes is well established and is widely used to measure the separation between the two surfaces in the Surface Forces Apparatus (SFA). An animation and simple description of primary FECO's in a typical experiment can be found in annex A. The electric field has to be continous at all interfaces which leads to the basic equations describing the interferometer. An illustrative animation of the electric field inside a three-layer interferometer can be found in annex B.
Definition: The condition for constructive interference (i.e. exact wavelength of a FECO) is met if the total increase of the phase of a plane wave, traveling one full cycle, through reflection on both mirrors, is a multiple N of 360°. N is also called the chromatic order of that particular FECO.
Note: Sometimes, N is set equivalent to the number of nodes or anti-nodes of the electric field. This is actually wrong because a) there is not really a standing wave inside the interferometer due to transport of energy (see annex B), and b) real mirrors exhibit a phase change upon reflection which may easily change the electric field enough to produce a contradiction.
The other 5 possible fringe patterns have never been studied in detail altough they form together what is usually referred to as a fine background intensity modulation which is superimposed to the predominant primary fringe pattern. The following will describe these additional fringe patterns and illustrate their use for determining surface topography.
Visibility of Secondary Fringes
The following animation shows how the visibility for primary, secondary and gap fringes varies as a function of the reflectivity of the mirrors (outer interfaces):
Gap fringes are best seen at R=0 (as horizontal lines) and primary fringes are sharpest for R~1 (typical fringe shapes). Secondary fringes appear as vertical lines which eventually dissapear when the mirror reflectivity reaches higher values. For high reflectivity, the secondary fringes disapear completely and the primary fringes become predominant and very sharp - so sharp that the limited number of pixels on this screen cannot display them anymore. Note that the positions of the secondary fringes coincide with typical distortions of the primary fringes. Those subsidiary distortions are often used in practice to discern between "odd" and "even" order fringes, which is not always reliable (figure 4), as we may see below. One could say that secondary fringes act like lenses that cause a local horizontal distortion of the wavelength axis and give rise to the well known characteristic shape of the primary (and all other) fringes.
Reducing the Mirror Reflectivity
The best visibility of secondary fringes is achieved if the reflectivity of the outer interfaces (mirrors) is similar to the reflectivity of the inner interfaces. Therefore, the reflectivity of the mirrors has to be reduced. This can be achieved by reducing the mirror thickness. I have calculated FECOs for different silver layer thicknesses and composed the animation in Figure 3.
You will notice, that the wavelengths of primary and secondary fringes vary as a function of the silver thickness, especially for thin (<250Å) layers, which is not the case in figure 2. This effect can be explained if we consider the phase change that occurs during the reflection at the mica-silver interfaces (for more information see annex C). Namely, one can show with basic optics that the phasechange is a function of the mirror thickness, especially for thin layers. Primary and secondary fringes are equally affected, since they both arise from reflections at the outer interfaces.
Varying the Inner Interfaces
Above, I had changed the optical properties of the outer interfaces by changing its reflectivity (figure 2) or its thickness (figure 3). Here, I will show what happens if one modifies the inner interfaces. The two surfaces have a refractive index µ1=µ2=1.5 and are in a flattened contact. The refractive index of medium 3 (gap) varies from 1.0 to 2.3.
In contrast to figure 3, only secondary fringes change their wavelengths as the refractive index in the gap varies. This is because primary fringes do not arise from reflections at the inner interfaces. If the refractive index in the gap is higher than in the surfaces, a phasechange of 180 ° occurs during reflection and the secondary fringes 'hop' by half their interfringe separation from one primary fringe to the next.
- For n3=1.0, the secondary fringes coincide with even (chromatic) order fringes inside the contact zone. Therefore, even (chromatic) order fringes look 'wide' around the contact zone.
- At n3=1.5, odd and even order fringes look alike and there are no subsidiary distortions visible in the primary fringes - the inner interfaces have disappeared.
- For n3=2.3, the secondary fringes coincide with odd (chromatic) order fringes inside the contact zone. Therefore, even (chromatic) order fringes look 'narrow' around the contact zone.
As a consequence, and, against common practice, the shape of primary fringes must be used with caution to determine the chromatic order of a primary fringe.

Topography and Secondary Fringes
Due to their nature, secondary fringes probe the surface topography. Secondary fringes curve according to variations in the thicknes of the corresponding surface layer. Looking at the shape of secondary fringes to gain topographic information is a very sensitive method.
The mirror reflectivity in this picture was tuned to match the reflectivity of the inner interfaces. There is an identical bulge on both surfaces which is growing in height from 0nm to finally 200nm. This system is symmetric, therefore, both secondary fringe patterns are identical.
Figure 6 shows the growth of the same bulge on one surface only. The interferometer is now increasingly asymmetric and one can observe 'beating' effects between the two secondary patterns.
Important: Due to the limited number of pixels available for this screen, additional interference patterns in the upper and the lower third of the picture may be produced. They are an artifact and should be ignored. This is generally applicable to all animations on this page.