Orthogonal Nanometer-Micrometer Roughness Gradients

While contrary effects of roughness feature-size have been observed on osteoblasts (see Micro-Scale Morphological Gradients and Nano-Scale Morphological Gradients), an orthogonal nanometer-micrometer roughness gradients was used to study the effect of roughness feature-size on osteoblasts (see Fig. 1).

Enlarged view: Fig. 1: The formation of a two-dimensional, orthogonal gradient: A micro-featured roughness gradient on one axis is combined with a nanoparticle density gradient
Fig. 1: The formation of a two-dimensional, orthogonal gradient: A micro-featured roughness gradient on one axis is combined with a nanoparticle density gradient

Method

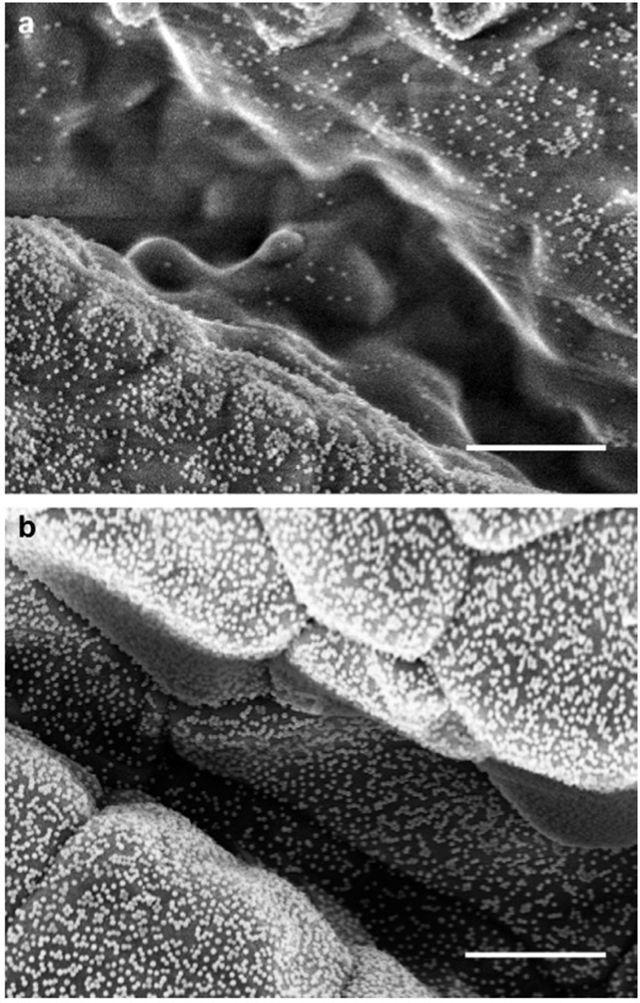
In this technique, a micrometer-scale morphological gradient was prepared as described previously. Ceramic replicates of those samples were then created by taking a first imprint of the roughness gradient in polyvinylsiloxane and filling up this mould with an alumina slurry. The dried green-body was then recovered from the mould and sintered. A thin layer of SiO2 was the deposited to smoothen the surface at the grain asperities and to be able to generate in the orthogonal direction a nanoparticle gradient as described in the Nano-Scale Morphological Gradients section, under ultrasonication to ensure nanoparticle adsorption in the deep grooves of the micrometer-feature gradient (see Fig. 2).

Fig. 2: Nanoparticle attachment in deep grooves of the micro-rough surface: SEM micrographs of grooves in the rough part of the micro-featured gradient. With the conventional method of stirring the particle suspension during the adsorption, parti- cles adsorb only on the outermost part of the surface. Only few particles are found at the bottom of the grooves (a). By additionally using ultrasonic pulses during the adsorption, cracks in the surface become homogeneously coated with particles (b). The scale bar is 2 µm.

Cell Reaction

Mineralization experiments were performed and an osteopontin marker was used to quantify the mineralization of the cells. Osteopontin production steadily increased with increasing microroughness, however, an intermediate nanofeature density additionally enhanced osteopontin production (see Fig. 3).

Enlarged view: Fig. 3: Fluorescence intensity of osteopontin immunostaining as a function of microroughness and nanofeature density: At the smooth end on the micrometer level, the particle density does not seem to affect the osteopontin formation. With increasing microroughness, however, an intermediate nanofeature density additionally increases osteopontin production. The error bars represent the standard deviation over 6 individual samples.
Fig. 3: Fluorescence intensity of osteopontin immunostaining as a function of microroughness and nanofeature density: At the smooth end on the micrometer level, the particle density does not seem to affect the osteopontin formation. With increasing microroughness, however, an intermediate nanofeature density additionally increases osteopontin production. The error bars represent the standard deviation over 6 individual samples.

References

Zink, C.; Hall, H.; Brunette, D. M.; Spencer, N. D., external pageOrthogonal nanometer-micrometer roughness gradients probe morphological influences on cell behavior. Biomaterials 2012, 33(32), 8055-8061.

JavaScript has been disabled in your browser